Permittable is now Permavia. Read about our new name

Government & Policy

How Long Does a Building Permit Take? A City & County Performance Comparison

Back to Insights

What states promise, cities deliver, is a different story. Across the U.S. cities and counties that publish or have been audited on real numbers, the median time to issue a residential building permit runs from about 1 day to nearly 400. Where you build matters more than any single rule, and the completeness of the application is the biggest lever on the lived timeline.

This is Part 2 of The Permitting Map. Part 1 mapped what each state's law promises; here we look at what 118 cities and counties actually deliver, every figure linked to a Permavia permit guide cited to the official record.

Key takeaways

  • Measured residential-permit medians range from about 1 day (Cleveland) to nearly 400 (Honolulu), a gap driven by where you build, not by whether the state has a deadline.
  • Fastest measured: Cleveland ~1 day, Richmond ~5, Fort Worth and Helena ~7. Slowest single-family medians: Honolulu ~394, Maui County ~379.
  • Targets and reality diverge: Houston ~31 days against a 10-day target; Anaheim ~84 against a 10-to-20-day target, because the target measures one cycle and the lived number includes every resubmittal.
  • Six structural patterns, not the statute, set the timeline: completeness intake, discretionary review, resubmittals, environmental overlays, staffing, and authority structure.
  • Only about 41 of 118 jurisdictions publish or have been audited on a real outcome. Most of the country cannot tell you how slow it is.

How long does a building permit take? The spread runs 1 day to nearly 400

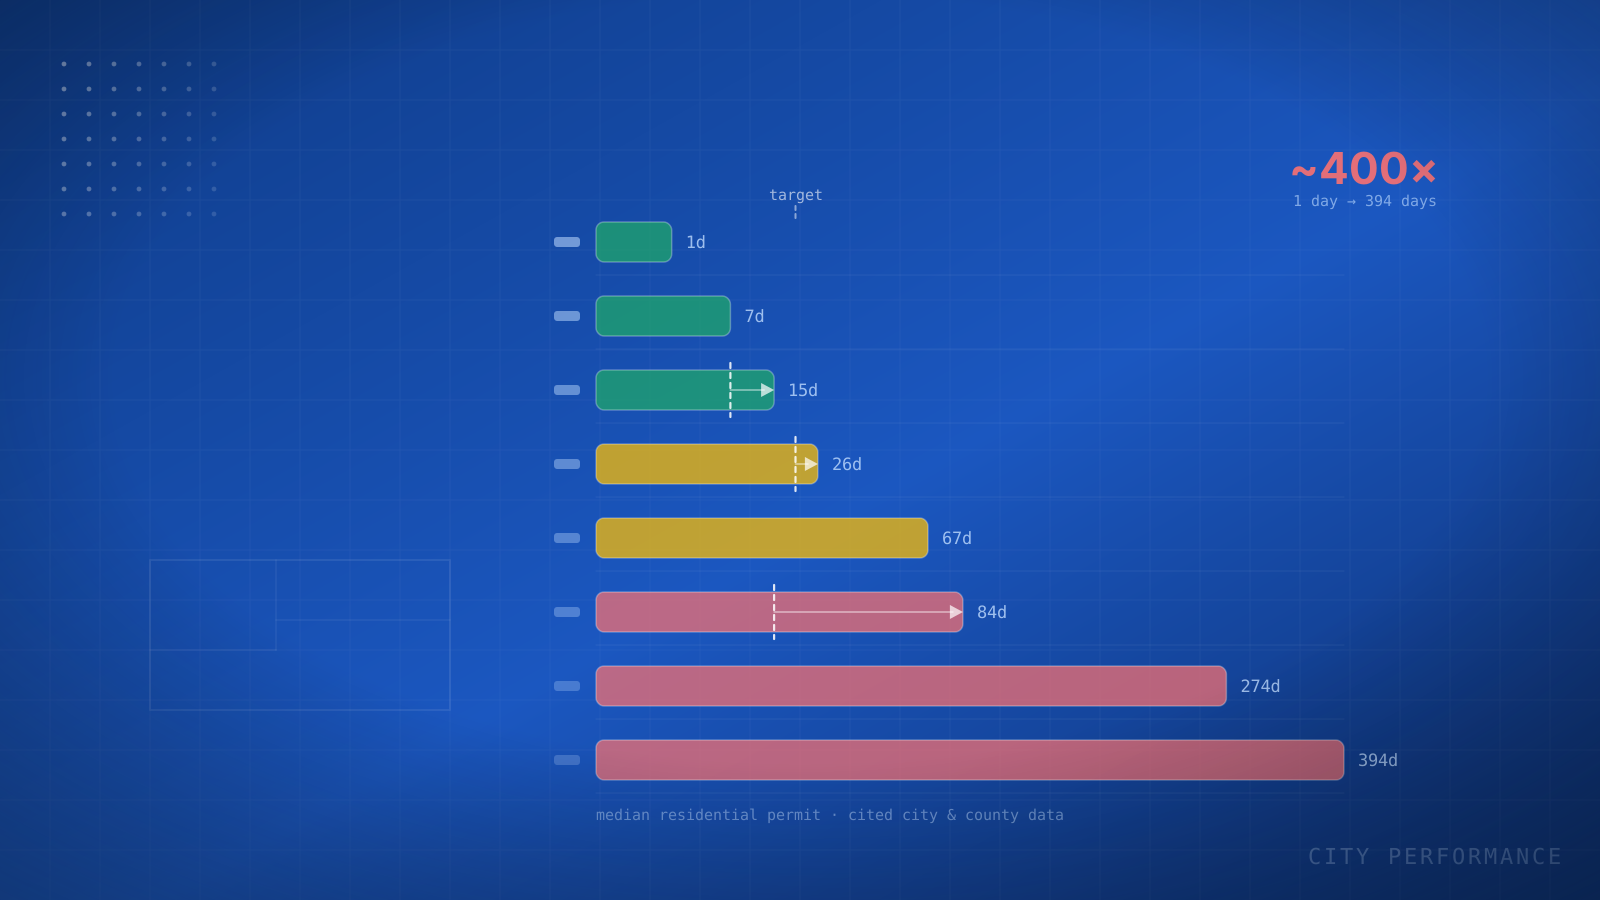
We pulled every city and county guide that cites a measured outcome and normalized the comparable figures to rough calendar days. On the cleanest like-for-like measure, the median time to issue a standard residential permit, the range is staggering.

Figure 1 · the showpiece
Median days to a residential permit, by jurisdiction
Fast at the top, slow at the bottom. Color marks whether a place beats, meets, or misses its own target.
7
30
90
180
300
394
Cleveland, OH
1d
Richmond, VA
5d
Fort Worth, TX
7d
Helena, MT
7d
Burlington, VT
9d
Milwaukee, WI
14d
Hartford, CT
14d
Baton Rouge, LA
15d
Atlanta, GA
17d
Cincinnati, OH
18d
Las Vegas, NV
19d
Sacramento, CA
20d
New York City, NY
20d
San Jose, CA
26d
Jacksonville, FL
28d
Salt Lake City, UT
29d
Houston, TX
31d
Phoenix, AZ
35d
New Orleans, LA
36d
Chicago, IL
48d
Oakland, CA
60d
Bellingham, WA
65d
Fairfax County, VA
67d
Anaheim, CA
84d
Detroit, MI
88d
Missoula, MT
106d
Austin, TX
108d
Tacoma, WA
111d
Hawaii County, HI
127d
Boulder, CO
200d
Denver, CO
274d
San Francisco, CA
280d
Maui County, HI
379d
Honolulu, HI
394d
Bar length scales to √days, compressed so 1-day Cleveland stays visible next to 394-day Honolulu; labels show the actual day count. Blue beats its target · gray near · amber over. Metric definitions differ per row; confirm each in its linked guide.

The fast end is genuinely fast: Cleveland at about a day, Richmond about five, Fort Worth and Helena about seven, Milwaukee and Hartford about two weeks. The slow end is dominated by Hawaii, where Honolulu and Maui County run a single-family median near a year, and by large California metros such as San Francisco. Hawaii is no accident: it was one of the high-burden states in Part 1, and its counties show why.

A word on honesty, because it matters for how you read the chart. A few jurisdictions report a deliberately different metric and should be read in their own lane, not ranked against a single-family median.

Figure 1b · different metric, own lane
Outliers that measure something else entirely
~6 months
Philadelphia, PA
Zoning-board hearing wait, not a plan review
391 days
Madison, WI
60+-unit project, letter-of-intent → permit
1.8 years
Los Angeles, CA
Average approval for a multifamily project
Kept separate from the spread because a fair comparison has to compare the same thing.

Promise versus reality: do the targets hold?

The most revealing view pairs a jurisdiction's own stated target against what it actually does. Both directions show up, which is what makes the data credible.

Figure 2 · target vs. measured
What they said. What they did.
Light bar is the target or cap; solid bar is the measured actual.
Review-window clockswhat one cycle of review is supposed to take
Helena, MT
10 target
7 actual
beats
Las Vegas, NV
21 target
19 actual
beats
Phoenix, AZ
45 target
35 actual
beats
San Jose, CA
20 target
26 actual
1.3×
Jacksonville, FL
30 target
28 actual
beats
Baton Rouge, LA
7 target
15 actual
2.1×
Houston, TX
10 target
31 actual
3.1×
Total elapsed timeapplication → issuance, every resubmittal included
Austin, TX
25 target
108 actual
4.3×
Anaheim, CA
15 target
84 actual
5.6×
Scope matters. The top group compares one review cycle. The bottom group, Austin and Anaheim, measures total application-to-issuance, which includes every applicant resubmittal: Anaheim’s 84 days dwarfs its 10 to 20-day target because the target measures one cycle while the lived number includes all of them.

Some places beat their target: Las Vegas runs about 19 days against a 21-day goal, Helena about 7 against Montana's 10-working-day cap, Phoenix about 35 against a 45-day goal. Many miss it, sometimes badly: Houston about 31 days against a 10-day target, Baton Rouge about 15 against a 7-day target. Anaheim is the cleanest case in the whole analysis: a median near 84 days computed from the city's own open permit data, against a posted 10-to-20-day review target. It dwarfs the target because the target measures one review cycle while the lived number includes every resubmittal.

Why do building permits take so long? Six structural causes

Read across all 118 city and county guides and the same six friction patterns appear again and again. They, not the statute, set the timeline.

  • The completeness gatekeeper. Almost every statutory clock starts only after an application is deemed complete, so intake screening, where applications bounce for missing items, never starts the clock.
  • Discretionary review outside the clock. Historic and design boards run on their own hearing calendars, from Miami Beach's preservation and design boards to Palo Alto's architectural review to Philadelphia's roughly six-month zoning-board wait.
  • Resubmittal and correction cycles. The gap between a one-cycle target and the multi-cycle reality is the resubmittal tax, and Anaheim is the worked example.
  • Environmental and disaster overlays. Hazard rules add parallel approvals the permit clock does not cover, like Scottsdale's desert-preservation regime, Naples and the FEMA 50-percent flood rule, and Colorado Springs's wildfire and expansive-soil reviews.
  • Capacity and staffing. Where examiners cannot be retained, the queue lengthens; Durham extended its site-plan review from 20 to 30 days in 2024 and said plainly it was staffing.
  • Structural authority quirks. The shape of the authority shapes the timeline: Colorado Springs uses a regional authority for eight jurisdictions, and Fairfax County is a heavyweight county department processing enormous volume.

The finding hiding in plain sight: almost no one measures

Here is the result that should change the conversation. Of the 118 city and county guides, only about 41 publish or have been audited on a real, measurable outcome. The rest, more than half, publish a target or describe a process but no actuals at all.

Figure 3 · who can even tell you
41 of 118 jurisdictions publish a real number
measures & publishes (41) target or process only (77)
77 of 118
cannot tell you how slow they are, because they do not measure application-to-issuance time, or do not publish it.
The handful that do (Anaheim, Fairfax County, Hartford, Baton Rouge and others working from open data) are the only places where promise and reality can even be compared.

You cannot benchmark against a number that does not exist, and most of the country does not produce one. The handful that do, like Anaheim, Fairfax County, Hartford, and Baton Rouge, are the only places where promise and reality can even be compared.

What this means for builders

A statutory deadline is a floor for the wrong thing: it governs one review cycle of the building permit, not intake, not discretionary review, and not your resubmittals, which is where the time actually goes. The lever that moves the lived timeline is completeness, because every pattern above compounds when an application arrives incomplete. And measurement is the prerequisite for improvement: the markets that beat their targets are, almost without exception, the ones that measure themselves.

That is why this permit guide directory exists, and why Permavia does. The fastest way to close the gap between the permit on paper and the permit in practice is an intake completeness check and a pre-submittal permit review that make the package complete before it ever reaches the counter, so the clock the statute promises actually starts. Read Part 1: the 50-state map of permitting regimes for what the law promises before the city ever opens your file.

Ready to build faster, smarter, and more confidently?

Learn how Permavia's AI-driven solutions accelerate approval timelines while improving compliance certainty.

explore solutions

Primary sources

Figures this article draws from Permavia permit guides trace to these sources of record. Open the guide for the exact table, page and measurement definition.

  1. City and County of San Francisco: Permit Performance Metrics & Board of Supervisors permitting review (opens in a new tab) (cited in San Francisco, CA)
  2. City of Anaheim Planning & Building Department: Building Division plan-review timeframes and Accela building-permits open data (opens in a new tab) (cited in Anaheim, CA)
  3. City of Cleveland / Ohio General Assembly: Building & Housing permits, design review & ORC §3791.04 (opens in a new tab) (cited in Cleveland, OH)
  4. City of Durham; North Carolina General Assembly: City-County Building & Safety, planning review notices, and NC 15-day residential rule (opens in a new tab) (cited in Durham, NC)
  5. City of Fort Worth: Development Services: Review Timeframes (opens in a new tab) (cited in Fort Worth, TX)
  6. City of Hartford, Department of Development Services: City of Hartford open permit data & Licenses and Inspections (opens in a new tab) (cited in Hartford, CT)
  7. City of Helena / Montana Dept. of Labor & Industry: City of Helena Building Division & Montana DLI (opens in a new tab) (cited in Helena, MT)
  8. City of Houston Permitting Center (Houston Public Works): Residential Plan Review: Fast Track New Single-Family (opens in a new tab) (cited in Houston, TX)
  9. City of Miami Beach; State of Florida: Miami Beach Building Department, land-use boards, and Florida permit shot-clock (opens in a new tab) (cited in Miami Beach, FL)
  10. City of Milwaukee / Wisconsin DSPS: Dept. of Neighborhood Services permits & WI plan-review timeframes (opens in a new tab) (cited in Milwaukee, WI)
  11. City of Naples; Collier County; State of Florida: City of Naples and Collier County permitting, FEMA 50% rule, and Florida shot-clock (opens in a new tab) (cited in Naples, FL)
  12. City of Palo Alto Office of the City Auditor; California HCD: Building Permitting Process Review (City Auditor, 2022) and HCD ADU findings (2024) (opens in a new tab) (cited in Palo Alto, CA)
  13. City of Philadelphia Department of Licenses & Inspections: Get a Building Permit: review targets (opens in a new tab) (cited in Philadelphia, PA)
  14. City of Phoenix Planning & Development Department: Plan Reviews: Turnaround Times (monthly report) (opens in a new tab) (cited in Phoenix, AZ)
  15. City of Richmond, VA: Permits & Inspections (Planning & Development Review) (opens in a new tab) (cited in Richmond, VA)
  16. City of Scottsdale Planning & Development Services: Plan Review Services targets and Environmentally Sensitive Lands Ordinance (opens in a new tab) (cited in Scottsdale, AZ)
  17. City-Parish of Baton Rouge / East Baton Rouge: City of Baton Rouge / East Baton Rouge Permits & Inspections (open permit data) (opens in a new tab) (cited in Baton Rouge, LA)
  18. Clark County (NV) Department of Building & Fire Prevention: Plan Review Timeframes (opens in a new tab) (cited in Las Vegas, NV)
  19. Fairfax County, Virginia, Land Development Services: Land Development Services FY24 Annual Report and development-review metrics dashboard (opens in a new tab) (cited in Fairfax County, VA)
  20. Pikes Peak Regional Building Department (PPRBD): Pikes Peak Regional Building Department permitting, code adoption, and volume data (opens in a new tab) (cited in Colorado Springs, CO)
  21. UHERO, University of Hawaiʻi Economic Research Organization: The Hawaii Housing Factbook (2026) (opens in a new tab) (cited in Honolulu, HI, Maui County, HI)

Frequently asked questions

How long does it take to get a building permit in the U.S.?

Across jurisdictions that publish or have been audited on real numbers, the median time to issue a residential permit ranges from about 1 day to nearly 400. Where you build matters more than any single rule, and the completeness of the application is the biggest lever on the lived timeline.

Which U.S. cities issue building permits fastest, and which are slowest?

Among measured residential medians, the fastest include Cleveland (about 1 day), Richmond (about 5 days), and Fort Worth and Helena (about 7 days). The slowest measured single-family medians are in Hawaii, with Honolulu near 394 days and Maui County near 379; large California metros such as San Francisco also run long.

Why do building permits take so long?

Six recurring patterns set the timeline more than the statute does: incomplete-application intake screening, discretionary reviews such as historic and design boards that sit outside the clock, resubmittal and correction cycles, environmental and disaster overlays, examiner staffing capacity, and the structure of the permitting authority itself.

Do statutory deadlines make city permits faster?

Not by themselves. A deadline governs one review cycle, not intake or resubmittals, so total elapsed time can be many times the posted target, for example Houston at about 31 days against a 10-day target, or Anaheim at about 84 days against a 10 to 20-day target. The markets that beat their targets are almost always the ones that measure themselves.

See your permit readiness before you submit

Run your plans through Permavia's Permit Review Diagnostic and get a clear, code-cited path to first-pass approval.